
Are you looking for a method to capitalize on significant market movements? MegaCap Momentum is a powerful momentum engine designed to effectively capture and maintain winning positions until their growth potential is fully realized.

Inspirations
MegaCap Momentum is a strategy that focuses on identifying breakout moments in the largest U.S. stocks while confirming the overall market's strength. Decisions are made at market closings, and the stockpicker keeps a diversified portfolio of momentum stocks for practical use and risk management. This blend of market strength and breakout seeks to capture continuation moves and hold them as long as the trend persists.
Key Components
Stock picker strategy using momentum ranking, with a maximum of 10 concurrent positions.
Apply a specific market filter based on the condition of a selected index.
Enter positions only in strong companies that are currently demonstrating their strength.
Exit positions when momentum is lost or the trend weakens.
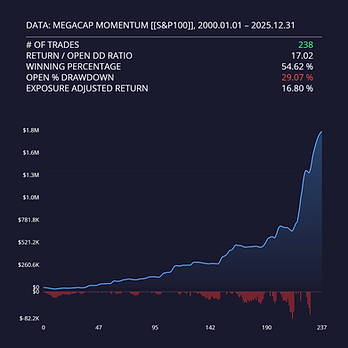
Backtest 1 – Fixed $ Money Management
The test variant with equal capital allocation across 10 positions from the S&P 100 index provides a stable picture of effectiveness over the long term. In this backtest variant, a constant amount of $100,000 was always invested ($10k per position).
Initial investment capital: USD 100,000
Testing period: 2000–2025
Tested years: 26
Tested instrument: S&P 100


In the table, we highlighted the moment when the strategy was published.


Click the button to see the latest backtest:
Backtest 2 – % Money Management
The percentage version demonstrates the strategy's effectiveness when fully utilizing available capital and reinvesting profits. In this approach, 100% of the current capital was employed, meaning the position's value fluctuated in proportion to the account balance, which started at $100,000.


Trading Strategy Analysis
Net Profit and CAGR
The strategy accumulated capital more quickly than SPY, as evidenced by higher net profit and a greater compound annual growth rate (CAGR). This indicates a long-term advantage with full capital utilization.
Drawdown and Return/Open Drawdown Ratio
The maximum drawdown was significantly lower than that of SPY, and the return/drawdown ratio was clearly better. This represents a more efficient use of risk than holding the benchmark.
Exposure
An average exposure of 71% means that part of the capital remains free, mostly in the bear market periods.

Winning Percent
A win rate of 54.62% demonstrates the signals' consistency (better than usual for trend-following strategies). At the same time, the average winning trade is about 4x larger than the average loss, which is typical for strong momentum systems and supports the robustness of the edge.
SL & TP
The strategy includes an embedded "fuse" via a fixed stop loss and a rule-based trailing stop, but does not implement a take-profit mechanism.
Market Regime
The strategy has been tested across fundamental market regimes and incorporates filters based on these conditions. Read more about market regimes.
Trading Costs
The tests considered transaction costs and slippage using data from the broker Alpaca. You can review our latest research on transaction costs with Alpaca here. With a diversified stock portfolio and strategy, transaction costs can significantly affect your profit or loss. Therefore, it's crucial to test and carefully select a broker.
Robustness
The strategy has successfully passed parameter modification tests. To enhance its robustness, we adopted a principle of minimizing the number of parameters. The criteria for selecting parameters included their significant impact on efficiency and alignment with the strategy's core nature. Additionally, the strategy performs well across other instruments, consistently generating profits.
We tested it on the S&P 500 and Russell 1000. Here are the results:

Monte Carlo Tests
MC Test 1, Modification of transaction order (resampling method) and skipping transactions with a 10% probability.

We have here a rather scattered chart, which is characteristic of Trend/Momentum strategies. The result of such strategies depends on a relatively small number of so-called outliers. The basic strategy lands in the average result in this study.
Test MC2, Modification of strategy parameters (20% probability of modification +/-20%) is retested each time.

Correlation
Correlation analysis is used to align strategies with different profiles and reduce overlap in risk. By analyzing correlation, you can avoid duplicating risk within a portfolio and more effectively integrate systems operating under various conditions. You can learn more about correlation here.
Summary
Strengths of the Strategy
The strategy examines the momentum effect and trends, phenomena supported by numerous scientific papers on financial markets.
It enables "winners to grow" when the trend is robust (avg. win is about 4x) bigger than avg. loss).
It excels during periods of strong market growth, even after reversal strategies have already secured profits.
Weaknesses of the Strategy
Momentum strategies tend to lose profits when market direction shifts, which is an anticipated behavior to consider.
These strategies are weaker during prolonged consolidations and "choppy" price movements, where reversal strategies tend to perform better.
They have relatively high exposure compared to strategies that focus on short-term trading.
Backtest results can vary based on the starting point, as the strategy captures and holds different stocks. Therefore, a backtest starting in 2000 was used to capture one of the largest bear markets in history in the worst-case scenario.
Summary
This system focuses on market strength and fresh breakouts, with the potential to outperform the broader market over the long term. It ensures reasonable exposure and disciplined exits, making it a suitable addition to a diversified portfolio. With effective capital management, this strategy can serve as a growth driver during trend periods.
What you get in the package for this strategy:
An eBook describing detailed rules and results of the strategy.
The SQX file is ready to use on the Algocloud and StrategyQuant platforms.
Pseudocode that describes all the rules in an easy-to-understand way.
Disclaimer
The results obtained from historical data do not guarantee future outcomes. The effectiveness of a strategy can change over time. Backtesting is a tool that allows for the analysis and evaluation of an investment strategy based on historical data. Various factors, such as market changes or economic conditions, can influence the effectiveness of a strategy over time.
Investing always involves risk. This material is not investment advice. We share our experience and algorithms for educational purposes. We make efforts to ensure that our algorithms are error-free, but neither we nor the tools we use guarantee the absence of technical issues. Any decisions to use a particular strategy are made at your own risk and should be preceded by careful understanding and verification. You should always carefully consider your investment goals and risk tolerance before making investment decisions.
BEST STRATEGIES


Week Explorer Strategy
For last 40 years, the best day of the week on the US stock market has been Tuesday. The next day with the highest return is Wednesday. We present a strategy that skillfully exploits this market behavior by opening positions only on Mondays and cashing in profits in almost 70% of cases over the following days.


●
KO Christmas Rally Strategy
The seasonal holiday pattern on Coca-Cola is one fantastic example of how seasons affect stocks. The pattern has a logical justification, which is the association of the brand with holidays built over decades. This consequently influenced consumer and investor behavior before this period.
