
The Volta strategy uses a volume-based indicator as its foundation, which distinguishes the strategy profile from most typical reversal strategies. It is a mean reversion strategy that waits for a quick pullback in an uptrend.

Inspiration
Trend reversal strategies are very effective in the stock market, where opportunities for profit often arise during retracements. In this article, we will discuss the details of the Volta strategy, including its historical results and recommended trading instruments.
Key Components
Detecting pullbacks in an uptrend. The essence of this strategy is the ability to detect quick pullbacks in an uptrend. The strategy utilizes typical reversal behavior in the stock market and momentary pullbacks, expecting the trend to continue.
Volume and price as fundamentals. The indicator used in the strategy helps identify overbought and oversold conditions in the market, taking into account both price and volume, allowing for potential reversal points to be found. The Volta strategy includes a specific application and 2 filters that turn on and off depending on prevailing conditions.
The Stockpicker mechanism searches and automatically selects stocks that meet the entry criteria.
Backtest 1 - $ Money Management
In this variant, we invest a constant amount of $100k, which is divided by the maximum number of open positions (10). This results in a capital commitment of up to $10k per position.
We are testing the period of the last 30 years from 1995–2025.
The backtest automatically selects stocks that meet the criteria from the Nasdaq 100 index. It is important to note that the list of stocks included in the index changed over the years, which is taken into account in the Stockpicker data (survivorship bias).
Invested capital: $100k
Number of positions: 10
Maximum investment per position: $10k
Test period in years: 30
Tested years: 1995-2025
Tested Index: Nasdaq 100
Equity chart for this test:


In the table, we highlighted the moment when the strategy was published.


Click the button to see the latest backtest:
Backtest 2 - % Money Management
In this backtest, we are investing in a strategy that constantly uses 100% of the current capital (starting with $100k). This means that as the capital grows or decreases, the position value changes proportionally. The rest of the parameters remain unchanged.
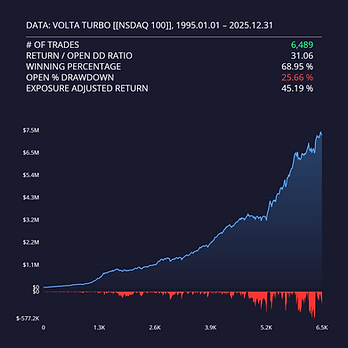
The equity chart for this test looks as follows. The chart includes a benchmark - a thin yellow line at the bottom (!).
A red line on the chart is an Open Drawdown line.

Basic statistics resulting from the test:


Trading Strategy Analysis
Net profit and CAGR
The net profit of 7,216,663 USD in the analyzed strategy is higher than the Benchmark (S&P 500 Index in the form of the SPY ETF marked on the chart in yellow), which is 2,449,918 USD, translating to a CAGR of 14.85% vs 11.00%.
Drawdown and Return/Drawdown ratio
The maximum Open Drawdown in the tested strategy was 25.66% compared to 55.19% in the benchmark, which still results in a clearly better Return/Open Drawdown profile for the strategy than for the benchmark.
Taking into account capital usage, the strategy achieved an exposure-adjusted return of 45.19% versus 11.00% for the benchmark, confirming that the strategy remains less risky and more stable, with smaller capital declines and clearly better risk adjusted performance than the benchmark.
Exposure

The average exposure in the tested strategy was 32.86% vs 100% in the benchmark. The study was conducted on the underlying instrument, which is the Nasdaq 100 index stocks. Exposure is measured by a dedicated study, which you can read about here.
This means that, on average, less than one-third of the capital was engaged in this strategy, leaving a large portion of funds free for other systems while still achieving the described returns.
Winning percentage
The winning percentage in the analyzed strategy was 68.90%. This means that almost 69% of transactions resulted in profit, highlighting the strategy's effectiveness in generating positive results and giving the user greater confidence in the frequency of achieving profits.
SL & TP
The strategy doesn't use a typical stop-loss and relies on an exit condition. But you can add an SL if it makes you more comfortable. Instead, diversifying positions within a single strategy and across the whole portfolio helps protect against the significant impact of a potential price change in one stock on the entire portfolio. Visit the stop loss order page.
Market regime
The strategy was tested in all basic market regimes and includes filters implemented based on this. Read more about market regimes.
Trading Costs
Trading costs and slippage were taken into account in the backtests. You can check our last research about trading costs using Alpaca Broker here. With a diversified portfolio of stocks and strategies, transaction costs can determine your profit or loss, so take the time to thoroughly test and choose a broker.
Robustness
Robustness was examined by practically conducting all possible transactions on stocks (max open positions 40) for the period from 1995-2025 for the S&P500 index (32,282 transactions) and Russell 1000 (41,995 transactions) at %MM.

Recommended instruments
The recommended primary instrument for this strategy on Algocloud Stockpicker is the companies in the Nasdaq 100 index, which have shown the best historical results. However, the strategy also shows stable results with stocks in the S&P 500.
Primary instrument: Nasdaq 100
Supplementary instrument: S&P 500
Pattern Day Trader
Good news. As of June 4, 2026, the existing Pattern Day Trader (PDT) rules are no longer in effect.
In practice, what matters is no longer the mere fact of executing several intraday trades in a short period of time, nor the former $25,000 threshold, but whether the account maintains an adequate margin buffer throughout the day. For investors, this means greater flexibility. Details of the changes are described by:
Finra Regulatory Notice 26-10 | FINRA.org
Alpaca: Understanding FINRA’s New Intraday Margin Rule and the End of PDT
Correlation
Checking correlation helps avoid duplicating risk in the portfolio and better combines systems with different profiles. You can find more about correlation here.
Summary & Strengths and Weaknesses
Over the course of 30 years, the analyzed strategy has not had a single losing year, which is a phenomenal result for a Stockpicker type strategy.
Strengths of the strategy:
Exceptional profits. In the analyzed strategy, Net Profit was $7.22M USD, while the Benchmark achieved above $2.45M USD. The CAGR was 14.85%, significantly higher than the Benchmark's 11.00%.
Low drawdown. The Max Drawdown in the strategy was 25.66% compared to 55.19% in the Benchmark. This shows that the strategy is much less risky and more stable.
High winning percentage. 68.90% of transactions ended in profit, highlighting the effectiveness of the strategy and providing a high level of comfort for users.
Robustness. The strategy was tested on the S&P 500 and Russell 1000 indices, resulting in nearly 75,000 transactions, respectively.
Weaknesses of the strategy:
Capital commitment. The strategy requires a relatively large trading account ($25k+ Account), because of the percentage of transactions ending on the same day, which is 13.3%. This may lead to meeting the Pattern Day Trader requirements mentioned above.
Summary
The Stockpicker type strategy demonstrates very high efficiency, low risk, and great stability over the long term. Such strategies can be the main drivers of the stock market portfolio.
What you receive in the package for this strategy:
An eBook presenting detailed rules and results of the strategy.
An SQX file ready to use on platforms like Algocloud and StrategyQuant.
Pseudocode describing all rules in an easy-to-understand manner.
Tradingview indicator code.
Disclaimer
The results obtained from historical data do not guarantee future outcomes. The effectiveness of a strategy can change over time. Backtesting is a tool that allows for the analysis and evaluation of an investment strategy based on historical data. Various factors, such as market changes or economic conditions, can influence the effectiveness of a strategy over time.
Investing always involves risk. This material is not investment advice. We share our experience and algorithms for educational purposes. We make efforts to ensure that our algorithms are error-free, but neither we nor the tools we use guarantee the absence of technical issues. Any decisions to use a particular strategy are made at your own risk and should be preceded by careful understanding and verification. You should always carefully consider your investment goals and risk tolerance before making investment decisions.
BEST STRATEGIES


Week Explorer Strategy
For last 40 years, the best day of the week on the US stock market has been Tuesday. The next day with the highest return is Wednesday. We present a strategy that skillfully exploits this market behavior by opening positions only on Mondays and cashing in profits in almost 70% of cases over the following days.


●
KO Christmas Rally Strategy
The seasonal holiday pattern on Coca-Cola is one fantastic example of how seasons affect stocks. The pattern has a logical justification, which is the association of the brand with holidays built over decades. This consequently influenced consumer and investor behavior before this period.
